Datasets
Here we apply the weather state construct to the ISCCP HGG dataset. See the D1 analysis below for more information.
The optimum cluster centroids are identified for K=10 as shown below.

Figure 1: Mean PC-τ plots for the HGG global domain

Figure 2: Geographic distribution of Weather States for the HGG global domain
To download ISCCP global, 3-hourly HGG weather state (WS) data in netCDF form, click here. The dataset is at 1-degree horizontal resolution, it currently (as of May 2021) covers the period from July 1983 to June 2017. It will be updated as the HGG dataset is expanded.
After downloading the HGG WS data, refer to the README.txt file for a detailed description of the data, the H1.py script for an example of using the data in Python, and H1.ipynb (requires jupyter notebook) for an interactive version of H1.py.
Please direct questions about the Global Weather States from HGG data to Dr. George Tselioudis or Dr. Jamine Rémillard.
This material is based upon work supported by the NASA MEaSUREs Program.
The merged weather states presented here are derived from the original non-merged datasets through merging of WS3 and WS6 into one cirrus category (CIR-WS3), and WS9 and WS10 into one stratocumulus category (STC-WS8). More details for the combination can be found in Tselioudis et al. (2021).

Figure 1: Mean PC-τ plots for the HGG global merged weather states.

Figure 2: Geographic distribution of Weather States for the HGG global merged states.
To download ISCCP global merged, 3-hourly HGG weather state (WS) data in netCDF form, click here and select the merged.zip archive. The enclosed datasets are at 1-degree horizontal resolution, and currently (as of May 2021) cover the period from July 1983 to June 2017. They will be updated as the HGG dataset is expanded.
After downloading the HGG WS merged data, refer to the README.txt file for a detailed description of the data, the H1.py script for an example of using the data in Python, and H1.ipynb (requires jupyter notebook) for an interactive version of H1.py.
Please direct questions about the Global Weather States from HGG data to Dr. George Tselioudis or Dr. Jasmine Rémillard.
This material is based upon work supported by the NASA MEaSUREs Program.
Introduction
The International Satellite Cloud Climatology Project (ISCCP) D1 gridded cloud product contains the distribution of cloud top pressure and cloud optical depth at each grid cell observed every 3-hours daily from 1983-2009. The distribution of cloud top pressure (PC) and optical depth (tau) fractions is referred to as a PC-tau histogram. A histogram displaying cloud top pressure and optical depth over some region reveals information regarding the type of clouds present (Rossow and Schiffer, 1999). Each PC-tau histogram contains 42 boxes, 6 optical thickness bins and 7 cloud top pressure bins (the bin sizes are not linear). One D1 PC-tau histogram contains the relative percentage of pixels that fall into each of these 42 boxes in the corresponding grid box (2.5 degree x 2.5 degree).
The optimum cluster centroids are identified for K=11 as shown below.

Figure 1: Mean PC-τ plots for the global domain

Figure 2: Geographic distribution of Weather States for the global domain
To download ISCCP global, 3-hourly weather state (WS) data, click here.
Get the binary file isccp_d1-gws_1983-2009.tar and the FORTRAN read program in ASCII read_o2_ISCCP_GWS.f. Untar of isccp_d1-gws_1983-2009.tar to get 27 data files named o2_dw_GL_8309_43.YYYY, where YYYY=1983 .. 2009. Use read_o2_ISCCP_GWS.f to read GWS values for your needs.
References
- Jakob, C., and G. Tselioudis (2003), Objective identification of cloud regimes in the Tropical Western Pacific, Geophys. Res. Lett., 30, 1-4, DOI 10.1029/2003GL018367.
- Rossow, W.B., and R.A. Schiffer (1999), ISCCP cloud data products, Bull. Amer. Meteor. Soc., 72, 2-20.
- Tselioudis, G.,W.B. Rossow., Y. Zhang, D. Konsta (2012) Global Weather States and their Properties from Passive and Active Satellite Cloud RetrievalsJ. Climate (Submitted)
INTRODUCTION
We extend to the whole tropics (±15° latitude) the analysis approach of Jakob and Tselioudis (2003, henceforth JT03) that uses the patterns of cloud property joint distributions at mesoscale (cloud type mixtures) to identify distinct states of the tropical atmosphere. This approach provides a more compact way to study multi-variate relationships among clouds, meteorology and energy-water exchanges (Rossow et al, 2005).
DATA AND ANALYSIS METHOD
We look for distinctive patterns in the joint frequency distributions of the cloud top pressure (PC) and optical thickness (TAU) values from individual satellite image pixels (fields-of-view about 5 km in size) occurring within 2.5° regions (upper limit of the mesoscale) that are provided in the International Satellite Cloud Climatology (ISCCP) D1 dataset (Rossow and Schiffer 1999). The histogram patterns that describe cloud variability are identified using the K-Means clustering algorithm (Anderberg, 1973) applied to 3-hourly PC-TAU histograms for each 2.5° region, including completely clear regions.
To download the analysis software, click HERE.
Unlike JT03, the “best” number of clusters is determined objectively by repeating the analysis for an increasing number of clusters (starting at four, since JT03 tested 2-4 clusters) and judging the outcome by four criteria: (1) the resulting centroid histogram patterns must not change significantly (as judged by the pattern correlations among the centroids) when the random number initiating the analysis or the subset of data analyzed is changed, (2) the resulting centroid patterns should differ from each other significantly (pattern correlations should be low, usually < 0.6), (3) the spatial-temporal correlations of the centroid histograms should also be low, and (4) the distance between cluster centroids should be larger than the dispersions of the cluster member distances from the centroid. Tests illustrated below for K=5-7 showed that the results were unstable (violation of the first criterion) when the cluster number was too small (K < 6 in this case) and that, when the cluster number was increased, the patterns of the new clusters were still significantly different from each other (second criterion). When there were too many clusters (K > 6), two or more of them would have very highly correlated PC-TAU patterns, as well as highly correlated spatial distributions or time variability (usually all three). In particular, two of the K-cluster patterns are highly correlated with a single cluster pattern from the (K-1) analysis, indicating a splitting of that cluster. The last criterion is actually used in the analysis to optimize the cluster set, so it is always met; but a post-facto check showed generally decreasing dispersion-to-separation distance ratios as the number of clusters increases. For K = 6 the average dispersion-to-separation distance ratio is less than one half.
 | Inter/Intra-Cluster Dispersion Ratio
Mean Value = 0.90 Correlation Coefficients
| ||||||||||||||||||||||||||||||||||||||||||||||||||||||||||||||||||||||||||||||||||||||||||||||||||||||||||||||||||||||||||||||||
 | Inter/Intra-Cluster Dispersion Ratio
Mean Value = 0.92 Correlation Coefficients
| ||||||||||||||||||||||||||||||||||||||||||||||||||||||||||||||||||||||||||||||||||||||||||||||||||||||||||||||||||||||||||||||||
 | Inter/Intra-Cluster Dispersion Ratio
Mean Value = 1.01 Correlation Coefficients
|
Correlation Coefficients Between 5 and 6 Clusters
| Correlation Coefficients Between 6 and 7 Clusters
|
The optimum cluster centroids are identified for K=6 as shown above and reported below on the left. Next, each PC-TAU histogram for each 3-hr time step in each 2.5° map grid cell over the whole tropics is assigned to one of these clusters. We refer to these as “weather states” (WS) because JT03 showed that these cloud property patterns are associated with distinct states of the tropical atmosphere (Fu et al. 1990, 1994, Lau and Crane 1995, Del Genio and Kovari 2002). Variations of WS can then be represented by the frequency of occurrence maps for daily or longer time accumulations shown below.
Mean PC-τ plots for Tropics (15S-15N) |
Geographic distribution of clusters for Tropics (15S-15N) |
We also define frequency of occurrence distributions for larger regions, 30°×30° latitude-longitude (beginning at 0E longitude), accumulated for daily or longer time periods (completely clear regions are counted as a 7th frequency category). To examine the time variations of the WS frequencies of occurrence, we used a wavelet (Morlet mother wave, Torrence and Compo 1998) analysis.
Click here for WAVELET ANALYSIS RESULTS
REFERENCES
- Anderberg, M.R. (1973), Cluster Analysis for Applications, 359 pp., Academic Press, New York, NY, USA.
- Del Genio, A.D., and W.K. Kovari (2002), Climatic properties of tropical precipitating convection under varying environmental conditions, J. Climate, 15, 2597-2615.
- Fu, R., A.D. Del Genio and W.B. Rossow (1990), Behavior of deep convective clouds in the tropical Pacific deduced from ISCCP radiance data, J. Climate, 3, 1129-1152.
- Fu, R., A.D. Del Genio and W.B. Rossow (1994), Influence of ocean surface conditions on atmospheric vertical thermodynamic structure and deep convection, J. Climate, 7, 1092-1108.
- Jakob, C., and G. Tselioudis (2003), Objective identification of cloud regimes in the Tropical Western Pacific, Geophys. Res. Lett., 30, 1-4, DOI:10.1029/2003GL018367.
- Lau, N-C., and M.W. Crane (1995), A satellite view of the synoptic-scale organization of cloud properties in midlatitude and tropical circulation systems, Mon. Wea. Rev., 107, 1984-2006.
- Rossow, W.B., and R.A. Schiffer (1991), ISCCP cloud data products, Bull. Amer. Meteor. Soc., 72, 2-20.
- Rossow, W.B., Tselioudis, G., Polak, A., and Jakob, C (2005), Tropical Climate Described as a Distribution of Weather States Indicated by Distinct Mesoscale Cloud Property Mixtures, Geophys. Res. Lett., 32.
- Torrence, C., and G.P. Compo (1998), A practical guide to wavelet analysis, Bull. Amer. Meteor. Soc., 79, 61-78.
Introduction
Distinctive mesoscale distributions of cloud top pressure and optical thickness have been identified in the tropics and shown to indicate different states of the atmosphere, particularly distinguishing between deep-convectively-active and suppressed conditions (Jakob and Tselioudis 2003, Rossow et al. 2005). However, since these cloud regimes were limited to daytime conditions because cloud optical thickness was determined from reflected sunlight, the effective time sampling scale is one day.
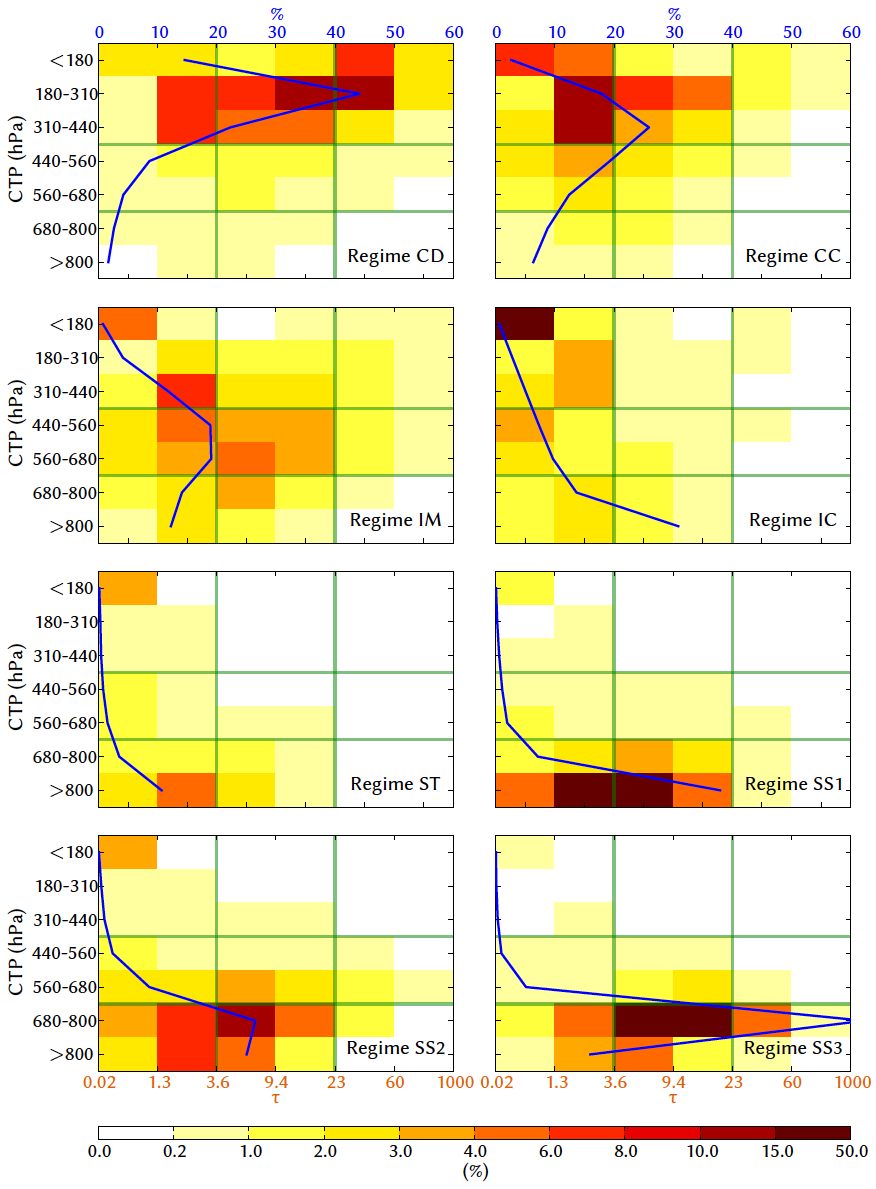
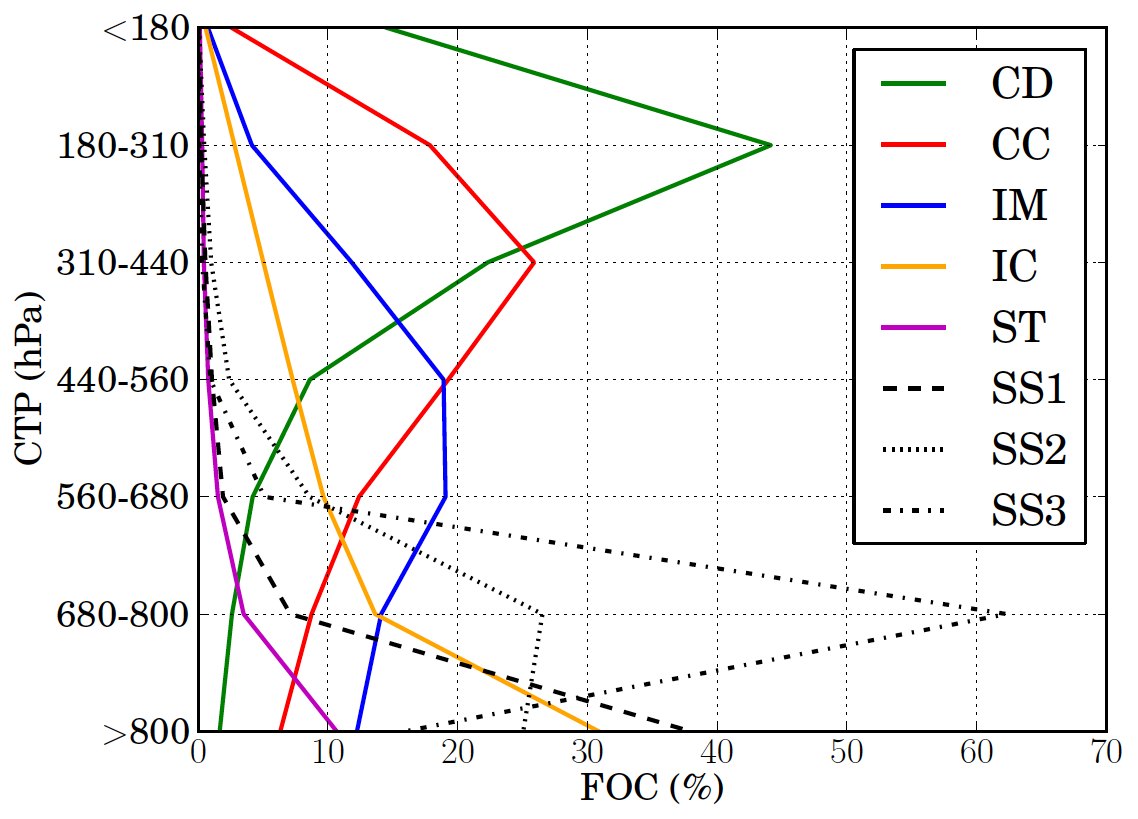
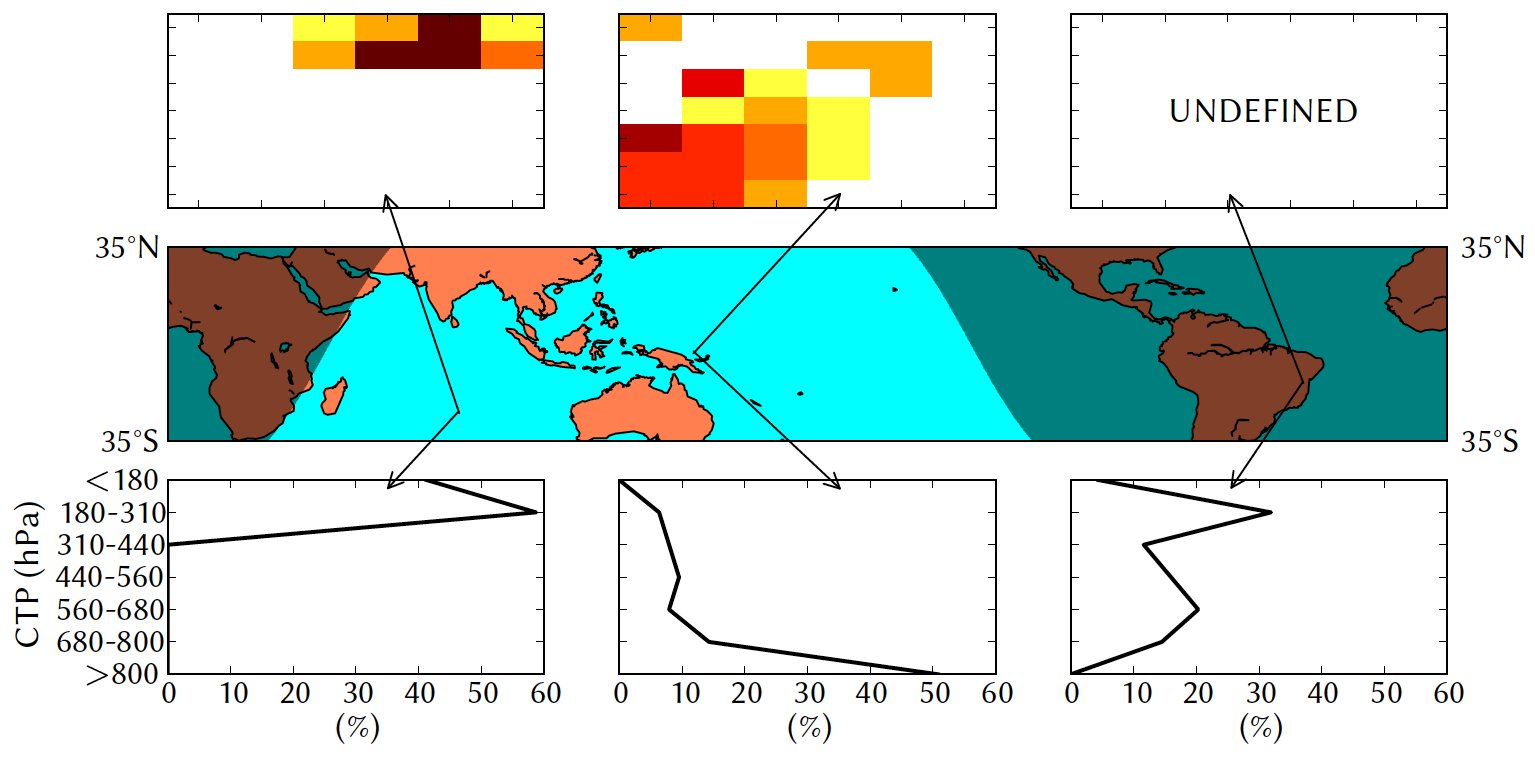
Tan and Jakob (2013) have extended this analysis by compositing the profiles of cloud top pressure that are associated with the daytime cloud regimes so as to resolve diurnal variations of the cloud regimes. Although some regimes involving low-level cloudiness of different optical thicknesses are not separated, the main types of deep-convectively-active and suppressed conditions are still identified. The data product provides a classification of each 2.5 degree grid cell every three hours over the whole extended tropical zone (± 35° latitude) for the period of August 1983 through June 2008. The shape of the cloud top pressure profile patterns that define each of the eight regimes is shown in the figure below.
 |  |
 |
The data is recorded in NetCDF format.
To download the dataset (IRregimes.tgz), click HERE.
To download the cluster centroid (ir_centroids.txt), click HERE.
More information, as well as the data, are available at the Monash University Climate and Weather group.
References
- Tan, J., and C. Jakob (2013), A three-hourly data set of the tropical convection based on cloud regimes, Geophys. Res. Lett., 40, 1415-1419, DOI 10.1002/grl.50294.
- Jakob, C., and G. Tselioudis (2003), Objective identification of cloud regimes in the Tropical Western Pacific, Geophys. Res. Lett., 30, 1-4, DOI 10.1029/2003GL018367.
- Rossow, W.B., Tselioudis, G., Polak, A., and Jakob, C (2005), Tropical Climate Described as a Distribution of Weather States Indicated by Distinct Mesoscale Cloud Property Mixtures, Geophys. Res. Lett., 32.
The optimum cluster centroids are identified for K=8 as shown above and reported below.
 Mean PC-τ plots for extended low-latitudes (35S-35N) Mean PC-τ plots for extended low-latitudes (35S-35N)Download cluster centroids |  Geographic distribution of clusters for extended low-latitudes (35S-35N) Geographic distribution of clusters for extended low-latitudes (35S-35N) |
Note: Weather state values range from 1-8. In the cluster datasets, the value 0 indicates Clear; value 98 indicates darkness; and value 99 indicates missing data.
To download the datasets, click here (file D1.WS.ET.dat.gz).
References
- Anderberg, M.R. (1973), Cluster analysis for applications, 359 pp., Academic Press, New York, NY, USA.
- Del Genio, A.D., and W.K. Kovari (2002), Climatic properties of tropical precipitating convection under varying environmental conditions, J. Climate, 15, 2597-2615.
- Fu, R., A.D. Del Genio and W.B. Rossow (1990), Behavior of deep convective clouds in the tropical Pacific deduced from ISCCP radiance data, J. Climate, 3, 1129-1152.
- Fu, R., A.D. Del Genio and W.B. Rossow (1994), Influence of ocean surface conditions on atmospheric vertical thermodynamic structure and deep convection, J. Climate, 7, 1092-1108.
- Jakob, C., and G. Tselioudis (2003), Objective identification of cloud regimes in the Tropical Western Pacific, Geophys. Res. Lett., 30, 1-4, DOI 10.1029/2003GL018367.
- Lau, N-C., and M.W. Crane (1995), A satellite view of the synoptic-scale organization of cloud properties in midlatitude and tropical circulation systems, Mon. Wea. Rev., 107, 1984-2006.
The optimum cluster centroids are identified for K=9 as shown above and reported below.
 |  |
| Mean PC-τ plots for northern mid-latitudes (30N-65N) | Geographic distribution of clusters for northern mid-latitudes (30N-65N) |
Note: Weather state values range from 1-8. In the cluster datasets, the value 0 indicates Clear; value 98 indicates darkness; and value 99 indicates missing data.
To download the datasets, click HERE (file D1.WS.MN.dat.gz).
References
|
The optimum cluster centroids are identified for K=8 as shown above and reported below.
 |  |
| Mean PC-τ plots for southern mid-latitudes(30S-65S) | Geographic distribution of clusters for southern mid-latitudes(30S-65S) |
Note: Weather state values range from 1-8. In the cluster datasets, the value 0 indicates Clear; value 98 indicates darkness; and value 99 indicates missing data.
To download the datasets, click HERE (file D1.WS.MS.dat.gz).
A new, third-generation, high-resolution version of the ISCCP radiative flux profile product, ISCCP-FH, is now available. Like the second-generation ISCCP-FD, it includes all upwelling and downwelling, shortwave and longwave radiative fluxes at the top of the atmosphere (TOA), at three levels in the atmosphere, and at the surface using a complete radiative transfer model, developed from the GISS GCM ModelE with improved observations of the physical properties of the surface, atmosphere, and clouds based on the third-generation, International Satellite Cloud Climatology Project (ISCCP) H-series products. Results are obtained every three hours over the whole globe on a 110-km equal-area (EQ) global grid covering the time period July 1983 through June 2017 (to be extended as available). The ISCCP-FH product contains these fluxes for full, clear and overcast (cloudy) sky, along with the input data used in the flux calculations.
The ISCCP-FH product consists of five sub-products. Flux at TOA, Surface, Atmospheric profile and its monthly means, and Input data sets are available for download. See the README file in the documentation for additional information about the files.
Questions about using the ISCCP-FH product may be directed to Dr. Yuanchong Zhang of Columbia University at NASA GISS. Questions related to the ISCCP H-series data product may be directed to Dr. William Rossow.
- To access the FH data, you will be asked for a username and password. Enter “isccpfluxfh” and “clouds”, respectively.
- FH On-line Data
- FH Documentation and Publications
The old, second-generation ISCCP-FD product covering July 1983-December 2009 product with its five sub-products also remain available. See the ISCCP data product description page for more details.
References
Han, Q.-Y., W.B. Rossow, and A.A. Lacis, 1994. Near-global survey of effective cloud droplet radii in liquid water clouds using ISCCP data. J. Climate, 7, 465-497. (Read abstract.)
Han, Q., W.B. Rossow, J. Chou, K-S. Kuo, and R.M. Welch, 1999. The effects of aspect ratio and surface roughness on satellite retrievals of ice-cloud properties. J. Quant. Spectrosc. Radiat. Trans., 63, 559-583. (Read abstract.)
Wang, J., W.B. Rossow, and Y-C Zhang, 2000. Cloud vertical structure and its variations from a 20-year global rawinsonde data set. J. Climate, 13, 3041-3056. (Read abstract.)
Zhang, Y-C., W.B. Rossow, A.A. Lacis, V. Oinas, and M.I. Mishchenko, 2004. Calculation of radiative fluxes from the surface to top of atmosphere based on ISCCP and other global data sets: Refinements of the radiative transfer model and the input data. J. Geophys. Res., 109, (27 pp). Download PDF document and Auxiliary Material files (MS Word format).
Rossow, W.B., Y-C. Zhang and J-H. Wang (2005), A statistical model of cloud vertical structure based on reconciling cloud layer amounts inferred from satellites and radiosonde humidity profiles. J. Climate, 18, 3587-3605. Download PDF document
Zhang, Y., W. B. Rossow, and P. W. Stackhouse Jr. (2006), Comparison of different global information sources used in surface radiative flux calculation: Radiative properties of the near-surface atmosphere, J. Geophys. Res., 111, D13106, doi:10.1029/2005JD006873. Download PDF document
Zhang, Y., W. B. Rossow, and P. W. Stackhouse, Jr. (2007), Comparison of different global information sources used in surface radiative flux calculation: Radiative properties of the surface, J. Geophys. Res., 112, D01102, doi:10.1029/2005JD007008. Download PDF document
Zhang, Y., W. B. Rossow, P. Stackhouse, Jr., A. Romanou, and B. A. Wielicki (2007), Decadal variations of global energy and ocean heat budget and meridional energy transports inferred from recent global data sets,J. Geophys. Res., 112, D22101, doi:10.1029/2007JD008435. Download PDF document
Full documentation for the ISCCP-FD dataset can be found at the ISCCP website ISCCP Documentation of New Cloud Datasets (779K).


